Cross-posted from
Patterns That Connect
As the once-fringe idea that Democrats could sweep to power in the House becomes the new conventional wisdom, the closing days of the campaign will be partly informed by what people think this could mean. Naturally, those who were the last to see this coming will hog the airwaves and printspace telling us what it means. But the online reality-based community is used to that noise. So what should we be thinking instead? My tentative answer involves a review of some scholarly theorizing and a good hard look at election numbers since 1892, aided by a nice clean graph.
Increasingly, people are realizing that the prospect of a massive "wave" victory can be just as motivating as fear of defeat. Perhaps even moreso. But what is this "wave" we speak of? Some tell us it is rare event, that comes only once or twice in a lifetime ("water flowing underground"). This raises three questions: (1) What do they mean by that? (2) Is it true? (3) If so, what does that mean?
The first-take answers are:
(1) They are talking about so-called "critical" or "realigning" elections.
(2) They are relatively rare, but more like once-every-10-to-20 year events, if we count "sub-critical" elections the experts don't all agree on, but are noticeably not run-of-the-mill.
(3) This is a huge opportunity, and Dems should make the most of it.
Critical "Realigning" Elections
But that's only the beginning of the discussion. The classic notion of the critical election was one that defined the political landscape for several decades to come.
Wikipedia:
Realigning election or realignment are terms from political history and political science describing a dramatic change in politics. It may center on a "critical election" or be spread out over several elections. More specifically, they refer to any one of several United States presidential elections in which there are sharp changes in the rules of the game (such as campaign finance laws or voter eligibility), new issues, new leaders and new bases of power for each of the two political parties, resulting in a new political power structure and a new status quo that will last for decades. The usual focus is on the transition between party systems, as between the First Party System and the Second Party System, and then to the Third Party System and so on.
The central holding of realignment theory, first developed in the political scientist V.O. Key's 1955 article, "A Theory of Critical Elections", is that American elections, parties, and policymaking routinely shift in swift, dramatic sweeps.
The first examples were precisely spaced--eerily so: Washington's election (1788) followed 36 years later by Jackson's in 1824, followed 36 years later by Lincoln, 1860, followed 36 years later by McKinnley 1896, followed 36 years later by Roosevelt, 1932--all
presidential elections, you will note. And 36 years after Roosevelt--over a decade after the idea was first floated by V.O. Key--we arguably had another one: Richard Nixon in 1968.
The important point about these elections is that they served as more-or-less sharp breaks with the defining terms of politics in the years before them. This does not mean that the parties who won these elections necessarily dominated politics at all times. Indeed, the opposite party often controlled Congress, or even the White House for a significant portion of time, but they never dominated the terms of debate. The fact that Nixon's victory was followed by a long period of GOP presidential dominance while Dems retained control of the House--and most often the Senate as well--lead to the refinement of calling 1968 a de-aligning election. This concept came from Walter Dean Burnham.
More recently, a number of other candidate elections have been proposed--such as the Congressional elections of 1974 and 1994. But 1974 didn't change control of Congress, it merely increased an existing Democratic majority. In contrast, 1994 shifted control of the House from Democrat to Republican. This seems to be a true realigning election--a rare Congressional one.
But is this really true? My suggestion is that it's not--and the reason is very important for what this election means.
My objection to classic realignment theory comes from two directions--the micro-level of examining specific Congressional elections, and the macro-level of looking at historical forces on scales larger than 36-year cycles. Let me be clear--I have great respect for realignment theory. I think it makes good sense of a fairly long stretch of American political history. But it is far stronger as a descriptive theory than a predictive one, because of the larger forces that it cannot possibly account for.
Micro-Level Critique of Realignment Theory: It's The House, Stupid!
Before considering the macro-level objections, however, we need to start with the more easily-grasped micro-level ones. And these come directly from examining House races over time. I could have gone back to the 1850s, but the 1890s are early enough for the points I want to establish. As the chart below shows, the two most definite realigning presidential elections--1896 and 1932--were preceded by sharp shifts in House elections. (I use percentages to standardize across changes in House size.)
The chart below shows the House share controlled by Democrats (top, blue line) and the percent change in share (bottom, red line), regardless of whether its a gain or loss. The yellow lines mark the three realigning elections--two definite (1896 and 1932), one questionable, at best (1968). The dotted purple lines mark the congressional elections of 1974 and 1994:
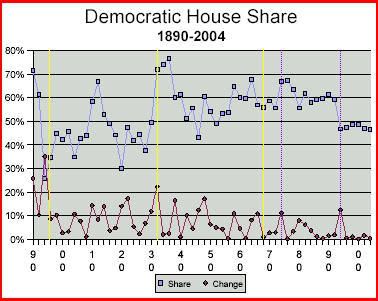
[See appendix at the end for a table with the underlying figures.]
In 1896, the Democrats had lost roughly 10% and 35% of the total House share in the two preceding elections. They lost so much that they actually gained back some marginal seats, even as they lost the presidential election of 1896. In 1932, the Democrats won more than 20% of the House share, on top of more then 10% in the 1930 election. Despite the slight difference in timing, these two elections shared three things: (1) a congressional shift preceded the presidential shift, (2) the congressional shift was substantial for two elections in a row, (3) the largest congressional shift in these two cases were the largest seen in the period covered. They are the only two shifts larger than 20%. (This is not an artifact of ignoring earlier data. A similar pattern occurred in 1858 and 1860, when Democrats lost 34.9% and 24% respectively. Party alignment broke down completely from 1820 to 1824).
It's worth noting that the next three largest shifts--in the 16-17% range--were compensatory, corrective elections: (1) The Democrats retaking power in 1948, following the first GOP House since before FDR took office in 1932. (2) The Democrats dropping from almost 80% down to 60% in 1938, losing about half their 1932 gains, plus all their 1934 and 1936 gains--but only after three straight elections winning over 70%. (3) The Democrats 1922 rebound of 17.4% following an almost-equal loss of 14.1% in 1920. Indeed, the period from 1910 to 1922 also saw the Democrats gain 14.4% in 1910 and lose 14% in 1914, rounding out the rest of the top eight, all of the elections in which more than one seat in eight changed hands. This period of time saw the Republicans split into progressive and conservative wings, giving the Democrats an opening to break the era of Republican dominance--which they ultimately failed to do. This is what this series of corrective and counter-corrective elections is all about.
Immediately below these in size of shift is the 1994 election, when the GOP gained 54 seats--just shy of one in eight (12.5%). It is followed by the Democrats 1946 loss (12.4%)--producing a GOP majority that lasted just two years--the Democrats 1930 gain of 11.9%, and the Democrats 1974, post-Watergate gain of 11.9%. The Democrats 1958 gain of 11% comes next--the last remaining shift of 11% or more.
A Pattern Emerges--Successful vs. Failed Realignment
If we put these all together, a pattern emerges: unambiguous realignment comes from two consecutive elections totaling at least a 30% shift, and they produce a two-term president who wins re-election easily. It is followed by a major corrective election coming within two to three cycles, which reduces the majority, but does not change control of the House. Failed realignments do not achieve that level of shift in such a short period. The Democrats failed realignment of the 1910s came close--with a combined 22.9% shift from 1910 and 1912, and a combined 31.9% shift from 1906 to 1912. The problem with taking so long to accumulate such a gain is that a turnaround is inevitable. Indeed, this series of five consecutive gains is the longest streak since 1890. The Republicans followed up by gaining share in the next four elections--taking back 36.7%. The Democrat's majority was gone in just two elections (1916). They would not have a majority again until 1932--eight elections later. Furthermore, this failed realignment produced a two-term president--Woodrow Wilson--but he won election only because the Republican Party was split with the Bull Moose defection, and he was re-elected only by a hair.
The Republican's failed realignment of the 1940s and 1950s was even weaker. They gained a House majority in 1946 on the strength of three staggered election gains topping 10%: 16.5% in 1938, 10.3% in 1942, and 12.4% in 1946, for a total of 39.8%. In between, however, the Democrats won 5.7% back (1940 and 1944 combined), and immediately after (1948) they won 17.2%. The GOP nibbled back, gaining 11.5% in the next two elections combined, to eke out a bare majority in 1952, when they finally elected a president--Eisenhower, a war hero who ran a decidedly non-ideological and largely non-partisan campaign. But they lost that majority the next election, and did not regain it again for 40 years--even though Eisenhower was easily re-elected.
Using these guidelines, it's obvious that Nixon's election in 1968 cannot be considered part of a realignment. The GOP did pick up 10.9% share in the 1966 election--but this was a correction to Democrats 8.3% share pickup in 1964, and was followed by only an anemic 1.1% pickup in 1968, and a 2.8% loss in 1970. Even without Watergate, there was nothing close to the makings of a realignment in these numbers, even (or perhaps especially) considering the deep split in the Democratic Party over race and civil rights.
De-Aligning Elections/Politics
However, this perspective on the failure of 1968 to measure up as a realigning presidential election reinforces the case--promoted by William Dean Burnham--for seeing it as a de-aligning election--one that breaks the connection between presidential and congressional voting, making divided government the norm. This same perspective also undermines the case for seeing 1980 or 1994 as realigning elections, since both simply undid temporary alignments of 1992, which produced a President and Congress of the same party. The actual realignment following 1994 did not take place until 2000--an election in which the "winner" lost by half a million votes, and won by a 5-4 vote of the Supreme Court. Although it produced a return to presidential/congressional alignment, the popular vote support was not there for it, and Jefford's defection reflected the mismatch of this reality with the ideological over-reach of the Bush administration. Without the accidental gift of 9/11, the 2002 election looked to repeat the pattern of 1994, returning to a solidly de-aligned configuration.
In short, this perspective on what makes for realigning elections reinforces the sense from other sources that where we find ourselves today is historically anomalous and unlikely to be stable. However, there's one more perspective to take on the micro-level before turning to macro-level considerations. This concerns the volatility of elections.
Decreased Volatility--A Longterm Process
If we look at the 26 elections from 1910 to 1960 (inclusive), we find that 11 of them had a shift in share of 10% or more, compared to 15 with a share shift of less than 10%. In comparison, the next 22 elections--from 1962 to 2004--look strikingly different: only three had share shifts of more than 10%, while 19 had share shifts of less than 10%. Examining the other extreme, just one election from 1910 to 1960 had a share shift of less than 1% and one more had a share shift less than 2%. In contrast, from the 1962 to 2004, six had share shifts under 1%, and another six had share shifts of 2% or less--combined, that's more than half the elections since 1960.
Clearly political volatility has dropped dramatically--as is perfectly obvious if one looks back at the chart above. The two most prominent peaks--1974 and 1994--would be quite unremarkable in the pre-1960 era. They are only regarded as exceptional, defining events because such volatility has become remarkably rare, not because they are historically significant. What's historically significant is the lack of half a dozen or so other elections like them since 1960.
Of course we're all familiar with explanations for why there's been so little change in Congress since the GOP took power in 1994. But this longer-term perspective tells us that this is just an accentuation of a much longer trend. Up until recently, when the conventional wisdom was that the Democrats could not retake the house, this equated to saying that the share shift would not be more than 3.5%--what it was in 1978. From 1910 to 1960, only 5 out of 26 elections were that placid. It is unthinkable that such a disastrous term as the past two years would result in such a placid election. But since 1962, 14 of 22 elections had shifts of less than 15 seats, 7 were more volatile, and one (1978, as noted) saw a shift of exactly 15 seats. Aside from 1994, the last time an election saw more than 15 seats shift was 1984, when 16 shifted.
Decreased Volatility and The Macro-Environment
This recent history is indicative of a changed macro-historical environment. Whatever commonplace explanations we may have--increased advantages of incumbency, the perfection of bipartisan gerrymandering, etc--these need to be seen as historical manifestations, along with the set of assumptions that encourages us to accept it as "just the way things are" and discourages us from seeking deeper historical perspectives.
If volatility had not changed dramatically, there would be some fairly straightforward conclusions to draw about this election and its significance--that one election is not enough to change things, and that we should be thinking in terms of how to make major gains in at least two consecutive elections. Seeing lack of volatility as part of the problem of a moribund political system, our goal should still be the same--but with the added caveat that we have to think very seriously about what to do to enhance volatility (aka the power of the people to choose their representatives, rather than the other way around). Serious campaign finance reform, such as the clean money model from Maine and Arizona, currently on California's ballot, would certainly be part of the solution. So would serious media reform, with reinstatement of the fairness doctrine as a no-brainer first step.
This is, in short, another supporting argument in favor of Chris Bower's post-2004 election analysis conclusion that the way to grow the Democratic coalition is by aggressively embracing governmental reform. But it's also an invitation to think more deeply about what's behind decreased volativility, about what it means for our democracy, and the general welfare.
Just as the Beltway Dem establishment opposed--even ridiculed--the idea of running hard in a wide field in this election, in favor of narrow targeting, we should expect them to want to be satisfied with whatever majority we win in this election, trying to do what the GOP did after 1994--limit volatility to maintain whatever margin they have, rather than use power robustly to strive for more gains in a second election--which is the key to a true realignment. This may not always be so blatantly stated, but it will be the underlying operating assumption. It is already the operating assumption behind those who see no problem with taking as much K-Street money as we can.
The key to understanding our macro-environment comes from two books by Kevin Phillips--not from their main theses, but from important background themes. In Wealth and Democracy: A Political History of the American Rich, Phillips draws parallels to the three most recent world powers that preceded us: Spain, Holland and Britain. All three started off as industrious, productive domestic economies, with a healthy overseas trade. As their overseas trade came to dominate the world, more money, talent and resources went into trade itself, but even more into finance. At the peak of their power, each experienced a stunning, unexpected reversal--much as we did in Vietnam. After that, the finance sector really took off, to the benefit of the upper quarter or so of society, while the rest of society stagnated, producing a highly polarized society, legitimized by more than a generation of reactionary politics, until a breaking point is reached. This results in a broadly egalitarian, populist reformation, reigning in the power of wealth and taking steps to rebuild the domestic economy.
The growth of international power, to point of empire, and the concentration of economic power that goes with it seem like prime candidates for macro-level forces disrupting the earlier regularity of realigning elections. For a more fine-grain look at how this manifests, we need to turn to a second book.
In American Dynasty: Aristocracy, Fortune, and the Politics of Deceit in the House of Bush, Phillips discusses the cultural fascination with wealth and aristocratic lineage that began in the Reagan Era, then moves on to the specific politics of restoration--drawing parallels between the restoration of the GOP and the Bush dynasty after the Clinton presidency, and Stuart Restoration in Britain and the Bourbon Restoration in France. These parallels highlight a court-centered politics of nepotism, favoritism and incompetence, deeply estranged from concern for the common good. It's hard to imagine a more apt description of the Bush Regime and its constellation of enablers in Congress, the media, on K-street, and throughout the land.
Decreased volatility is but a natural symptom of the forces Phillips describes as part of the background of these two books. The good news is that these forces inevitably wane--as they seem poised to do in America today. How soon the tide is turned, how well and wisely a new order is constructed--these cannot be guaranteed by history. But the downfall of the current system is virtually inevitable. It is simply unsustainable, despite its own narcissistic fantasy of triumphant and eternal rule.
Hints For Constructing A New Majority
Phillips is a self-identified populist, by which he means he is economically liberal and socially conservative. This is how he characterizes the natural inclinations of the middle class, and of the reformation movements that follow the reactionary phase of politics. But the evidence related to social conservatism--and even its meaning--is a good deal fuzzier than that related to economic liberalism. Furthermore, the three previous examples Phillips cites were all much more culturally unified than multi-racial, multi-cultural America is.
It is natural to assume that economic liberalism will bind together a new majority more certainly than any social policy, for the simple reason that even a majority of conservative voters favor the welfare state. Views on a wide range of social issues are more fragmented and diffuse. Economic liberalism has been opposed by elites of both parties over the past thirty-odd years--but not by all of them, as seen, for example, in the mobilization of wealthy opponents of abolishing the estate tax.
The driving, defining force in the historical processes that Phillips describes is fundamentally economic--a restoration of broad equality in sharing the rewards of work. The notion that this is somehow culturally conservative derives from conservative caricatures of the welfare state, defining it in terms of its help for the most downtrodden and dysfunctional. But the vast majority of welfare state spending and benefit (including tax policies, investments in education, health, technology and infrastructure, etc.) has gone to the middle class to make them middle class. This should be our model in shaping new policies for the century ahead. Policies that broadly benefit everyone create conditions in which social and cultural tolerance flourishes.
The realignments of 1896 and 1932 hold important lessons for us. In the 1880s and 90s, the power of plutocracy was consolidated because the broad mass of people were divided. The rural populists, Jewish and Catholic immigrants and native Protestant working class were all structurally exploited by the Guilded Age plutocracy, but were deeply divided culturally--which is what allowed the realignment of the congressional elections of 1892 and 1894, leading up to the presidential election of 1896. This was not a stable arrangement, however, as seen in the progressive revolt, and the relative strength of the failed Democratic realignment, which nonetheless had a strong ideological component. In contrast, the realignment of 1930-1932 bought together the Catholic and Protestant working class, united the Northern urban working class with the South, and produced a much stronger coalition of forces, as seen in the much weaker failed Republican realignment.
Thus, what's needed for a new realignment is the bringing together of previously splintered groups with common economic interests (the lesson of 1932), but it's also helpful to splinter the other side (the lesson of 1896). It's safe to say that 2006 is primarily a referendum on the Republicans, and is playing out as a substantial splintering of their side. This is the prime significance of the Foley scandal. While it is relatively minor in real-world significance, it is a major disruption of the GOPs conservative discourse, threatening to utterly undo the alliance of convenience between social conservatives and economic conservatives. A successful realignment--not just for the next election cycle or two, but for generations--requires that the 2008 election is about bringing together previously splintered groups. This is what the GOP failed to do following its 1994 success. The failure was hardly surprising, given the nutcase leadership of Newt Gingrich, But we need to work hard not to repeat his mistake.
There will be at least three different versions of how to bring groups together that we are likely to see. One from the Beltway and two from the netroots.
The Beltway's favored solution is--as always--to "move to the center," which means that Democrats again must move right. This will be supported by narratives about non-partisanship, blaming "extremism on both sides," etc. It means further abandoning economic populism, which enjoys the overwhelming support of the American people. It's the DLC all over again. The most plausible salesman of this approach is Barack Obama, who far too many people still mistake for a progressive. Well, some of his rhetoric surely is progressive. But that's rhetoric, not reality.
The netroots have two counter-visions. Markos--a former Republican--is the most visible supporter of a libertarian realignment. This is especially meant to appeal to people like him--people who resonate to traditional pre-religious right GOP narratives. Paul Hackett was a classic articulator of this view. Chris Bowers--a pragmatic lefty--supports a government reform agenda. It's not the New Deal, but it is New Deal 2.0. Government is and should be a much bigger player in this view, compared to the others, but transparency, responsiveness, and participatory democracy are central to this vision. It is very much about growing a deeply democratic culture, much as the union movement was in its pre-bureaucratic heyday.
The two netroots visions can either conflict with each other, or find common ground by concentrating on specific examples. The spirit that Markos is after--of autonomy and enterprise--has historically always required much more government support than people realize, from the building of canals and the Louisiana Purchase to the massive, prolonged government spending on science and technology that gave birth to Silicon Valley and the personal computing revolution. If we look toward specific challenges and how to meet them, we are far more likely to find ways that the two netroot visions can integrate into a coherent, but multifaceted whole.
An important aspect of doing this is looking for specific policy packages that address regional and sub-regional needs. Policies for the West, for example, will involve ways of bringing together environmentalists, ranchers, hunters and others to develop ways of preserving what's best and most distinctive about the land and its people, while developing new industries, technologies and cultural practices that give people a future as well as a past.
The New Deal had important regional aspects to it that are undeservedly forgotten. The Tennessee Valley Authority (TVA), for example, brought electrical power and economic development to a previous backwater. Regionally-specific policies, generated primarily by the people of those regions, should have an even bigger role to play this time around, both for pragmatic and for political reasons. They are the key to turning different regions blue, and the key to integrating the two netroots visions to provide a unified alternative to the Beltway/DLC vision.
It's also a hint at where to concentrate our efforts in the waning days of the election: on those races where we see and feel a particular opportunity and capacity for articulating a regional vision that serves to bring a national vision down to human scale.
Appendix: Dem House Share Table: 1890-2004*
% Gain/
Year % Share Loss
1892 61.2 -10.4
1894 26.0 -35.2
1896 34.7 8.7
1898 45.0 10.3
1900 42.2 -2.8
1902 45.6 3.4
1904 34.9 -10.7
1906 42.7 7.8
1908 43.9 1.2
1910 58.3 14.4
1912 66.8 8.5
1914 52.8 -14.0
1916 49.1 -3.7
1918 44.2 -4.9
1920 30.1 -14.1
1922 47.5 17.4
1924 42.0 -5.5
1926 44.5 2.5
1928 37.7 -6.8
1930 49.6 11.9
1932 71.9 22.3
1934 74.0 2.1
1936 76.7 2.7
1938 60.2 -16.5
1940 61.3 1.1
1942 51.0 -10.3
1944 55.6 4.6
1946 43.2 -12.4
1948 60.4 17.2
1950 54.0 -6.4
1952 48.9 -5.1
1954 53.3 4.4
1956 53.7 0.4
1958 64.7 11.0
1960 60.1 -4.6
1962 59.5 -0.6
1964 67.8 8.3
1966 56.9 -10.9
1968 55.8 -1.1
1970 58.6 2.8
1972 55.6 -3.0
1974 66.8 11.2
1976 67.1 0.3
1978 63.6 -3.5
1980 55.6 -8.0
1982 61.8 6.2
1984 58.1 -3.7
1986 59.3 1.2
1988 59.7 0.4
1990 61.3 1.6
1992 59.3 -2.0
1994 46.8 -12.5
1996 47.3 0.5
1998 48.5 1.2
2000 48.7 0.2
2002 46.9 -1.8
2004 46.4 -0.5
* Note: Unlike the chart, this table gives the change in shares as gain (positive) or loss (negative). The absolute value of this column was used in the table, in order to focus attention on the magnitude of change.
